Ines Neumann · 4 September 2026
Valley Beekeepers Integrate Data Logging Systems to Track Hive Health in Growing Habitats
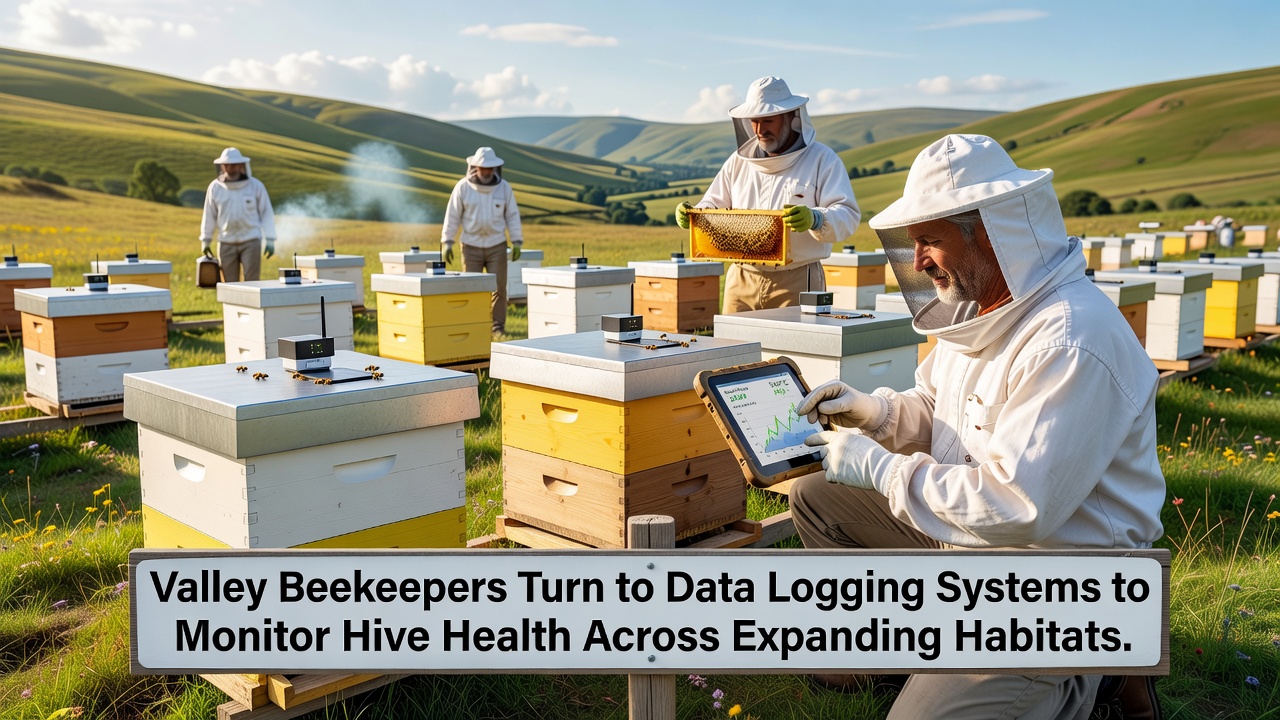
Valley beekeepers have turned to data logging systems that record temperature, humidity, and vibration patterns inside hives, and these tools now support monitoring efforts across habitats that continue to expand through conservation initiatives and land management programs. The systems transmit readings wirelessly to cloud platforms where algorithms flag deviations from established baselines, allowing operators to respond before colony stress escalates into measurable losses.
Expansion of Monitored Habitats
Habitat growth in the valley region has added several hundred acres of protected forage since 2024, and beekeepers have responded by deploying compact sensor arrays that fit inside standard hive boxes without disturbing bee activity. Each unit logs data at five-minute intervals and stores readings locally for up to thirty days in case of temporary network outages, while the same devices forward summaries daily to regional databases maintained by agricultural extension services. In September 2026, preliminary figures from the valley network showed a 22 percent increase in the number of hives equipped with continuous monitoring compared with the previous season, according to records compiled by the local beekeepers association.
Technical Components in Use
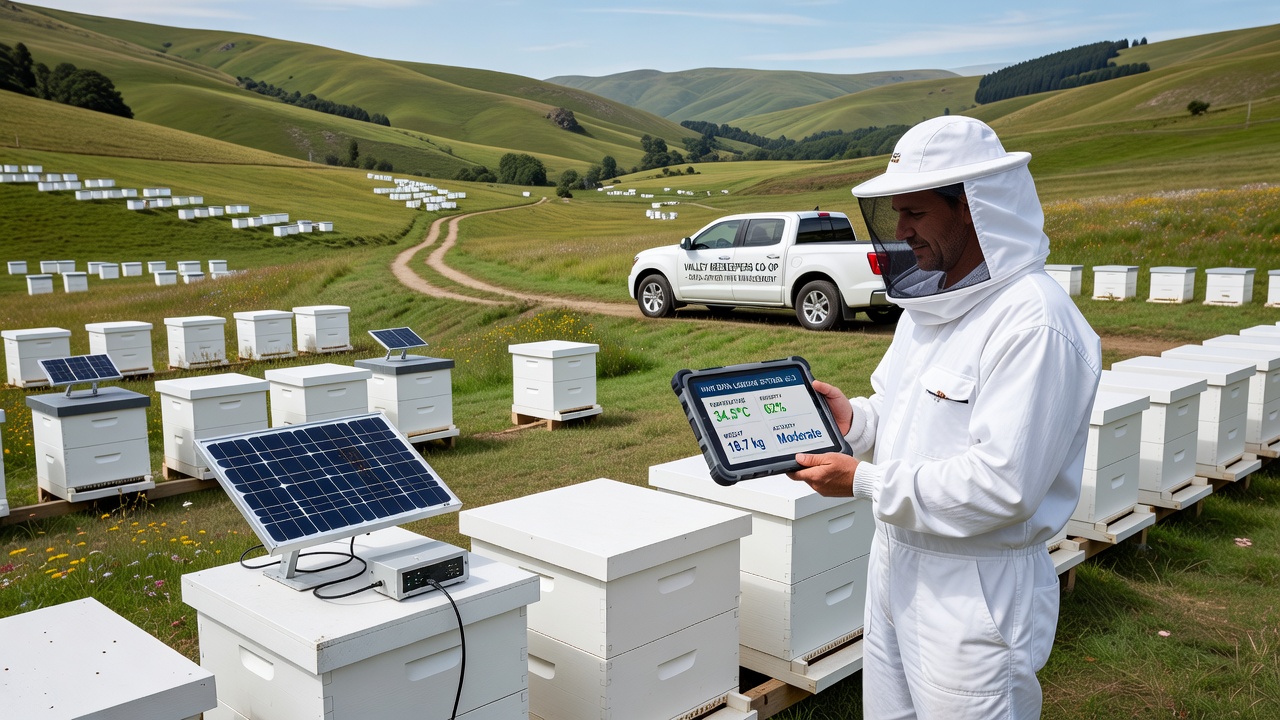
Modern logging units combine low-power temperature and humidity probes with accelerometers that detect unusual hive movement, and these components run on batteries rated for twelve months of operation under typical field conditions. Software dashboards present the information through color-coded alerts that highlight hives requiring inspection, and operators can drill down to hourly trends when patterns suggest possible queen failure or varroa mite pressure. One installation in the northern valley section uses solar-assisted panels to extend battery life during extended cloudy periods, while another site in the southern meadows relies on mesh networking to relay data across distances exceeding two kilometers.
Researchers at several universities have examined the correlation between logged environmental data and colony outcomes, and their analyses indicate that early detection of temperature spikes above 35 degrees Celsius inside brood chambers often precedes observable signs of distress by several days. The same studies note that vibration signatures associated with swarming can be identified up to 48 hours before departure, giving keepers time to intervene with additional space or queen excluders.
Data Sharing and Regional Coordination
Beekeepers participate in a voluntary data-sharing program that aggregates anonymized readings from multiple apiaries, and this pooled information helps identify broader environmental trends such as nectar flow timing shifts linked to changing weather patterns. The program draws on protocols developed by the Australian Department of Agriculture for similar monitoring networks in eucalyptus-dominated regions, while local adaptations incorporate soil moisture readings from nearby weather stations to refine forage availability forecasts. A separate collaboration with the European Food Safety Authority has supplied comparative datasets from Mediterranean climates that share temperature ranges with the valley during summer months.
Challenges Encountered During Rollout
Initial deployments encountered connectivity gaps in areas shielded by dense tree cover, and technicians addressed these by repositioning gateway units on higher ground or adding repeater nodes that extend signal range. Calibration drift in humidity sensors required quarterly checks against reference instruments, and keepers now maintain logs of these verification steps to ensure data integrity across seasons. Power interruptions during winter storms prompted the addition of backup capacitors that preserve critical readings until primary batteries can be replaced.
Training sessions organized through agricultural colleges have introduced keepers to basic data interpretation, and participants learn to distinguish normal seasonal fluctuations from anomalies that warrant field visits. Attendance at these workshops has grown steadily, with over 180 individuals completing the most recent module offered in the spring of 2026.
Conclusion
Continued expansion of monitored habitats and the parallel growth of data logging infrastructure have produced a detailed record of hive conditions across the valley, and the resulting datasets support both immediate management decisions and longer-term research into climate effects on pollinator health. The systems operate without replacing traditional observation methods, instead supplementing keeper experience with quantitative measurements that remain accessible year-round. As habitat area increases and sensor networks mature, the combined approach supplies a scalable model for regions facing similar pressures on bee populations.